
Flat, on your colors and fonts.
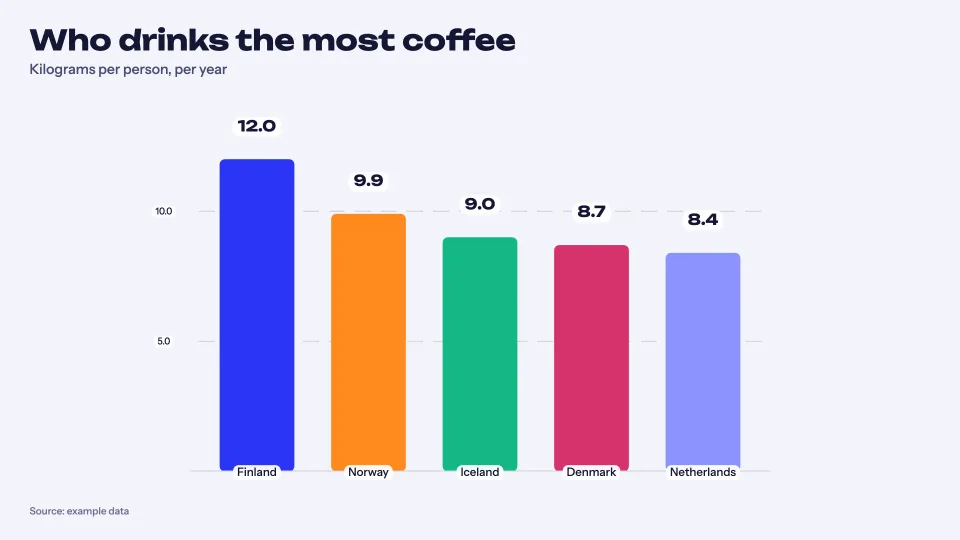
For slides, reports and articles. Click a gridline or a label to restyle it, as in a spreadsheet.
PNG on Free · SVG & PDF on Pro
Drop in a spreadsheet and get a chart that moves. Then take that same chart anywhere: a video for YouTube or Reels, an overlay for your edit, a still for the report, a live embed for your site. Flat or in 3D, with captions and your own music.
Try it right away, no sign-up needed. A free account (no card) lets you download and publish. Your data stays private.
Every chart you make is animated, so the still in your report, the video in your feed and the embed on your site are the same chart. Switch between flat and 3D at any point: the data, colors and timing stay put. These three are one coffee chart, each straight out of the export button.
For slides, reports and articles. Click a gridline or a label to restyle it, as in a spreadsheet.
PNG on Free · SVG & PDF on Pro
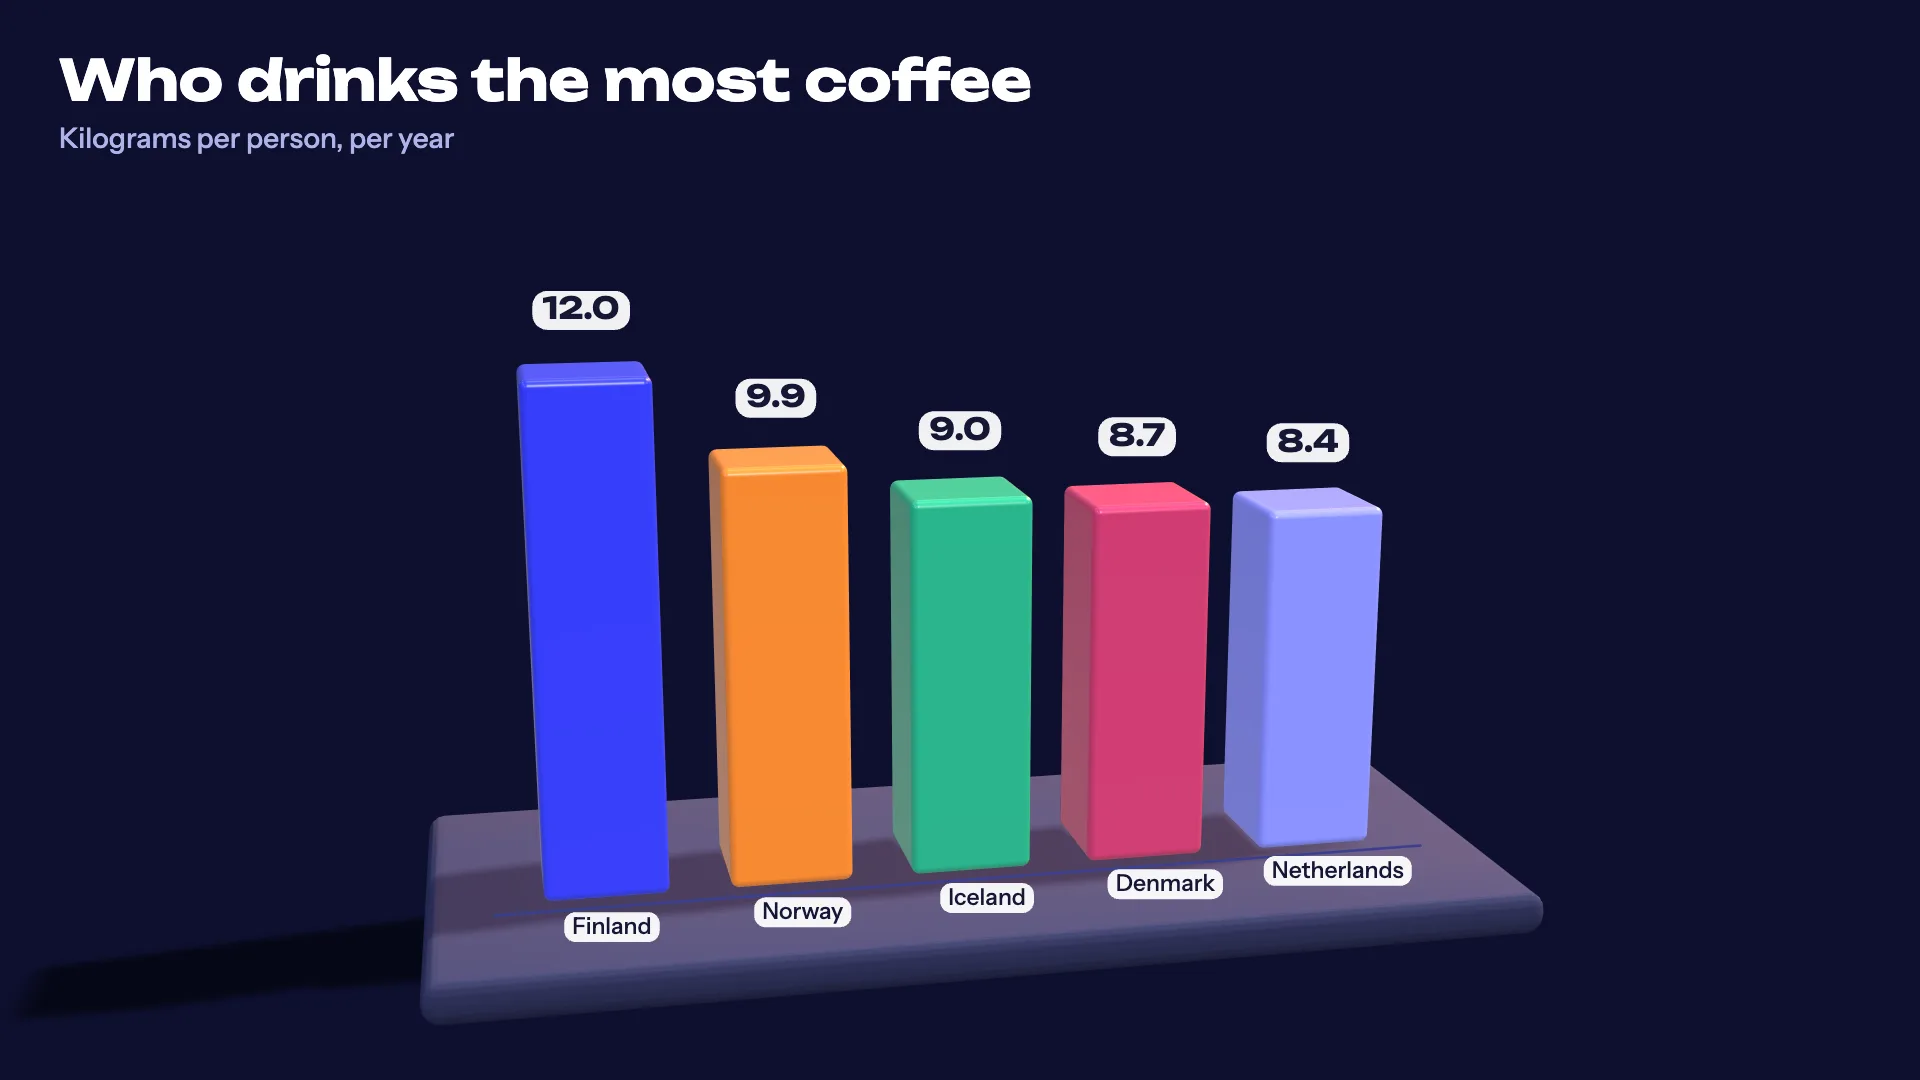
Camera moves, light and timing for YouTube and explainers, or a transparent overlay to drop on your footage.
MP4 & GIF on Free · 4K & transparent video on Pro
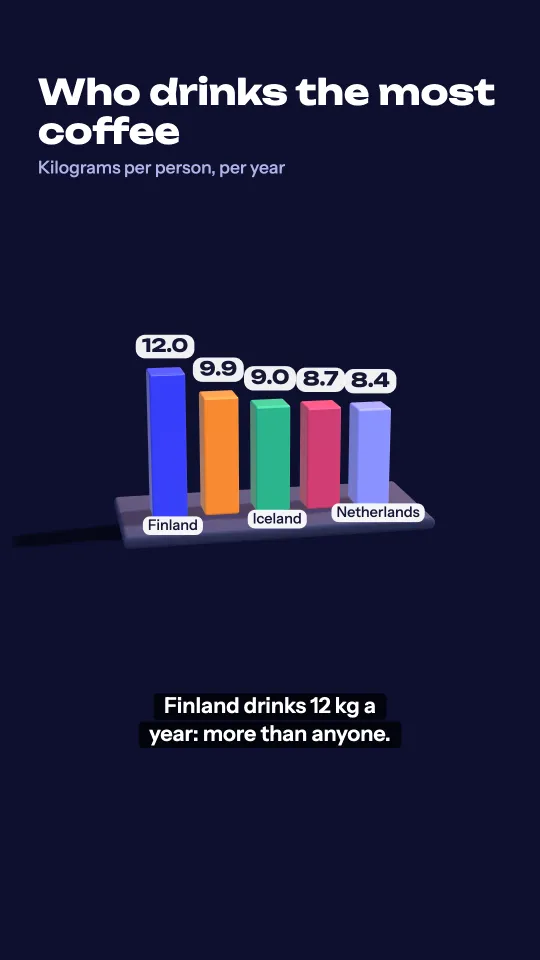
Captions written from your data tell the story with the sound off, and add your own music. Captions also download as an .srt file.
MP4 on Free · up to 2 minutes
Make your first chart No sign-up needed to try it.
Start with your data, choose a 2D or 3D view, then export a still graphic or an animation. No coding or animation software required.
Drop in a spreadsheet, paste rows from Google Sheets or Excel, or start from an example. We read the columns and match place names to the map.
Choose from 41 visuals, from bars and lines to Sankeys, parliaments and time spirals. Search finds the one you mean — “pie”, “spider”, “flow” — we suggest what suits your data, and you pick the colors and fonts.
Save a PNG for your slides, or export supported 2D charts as SVG or PDF with Pro. For video, download an MP4, GIF or transparent overlay in the format your edit needs.
Every classic your readers expect, and a shelf of charts nobody else has — parliaments of tiny seats, winners’ podiums, unit charts of little people, a year coiled into a spiral. Click any chart to see it live, rendered by the same engine you’ll use.
Live, with example data — every color, font and camera move is yours to change. Try it with your data
Three scenes rendered exactly as you'd download them. Each one loops cleanly, so it works as a cutaway or sits in a feed.
Show where your audience is, trace a trip or compare countries. The camera glides between places so your viewers always know where they're looking.
Pick where it's going and export. The chart doesn't change, only the file: a still or vector for print, a video for each channel, an overlay for your edit, or a link and embed code.
| Destination | Size | Frame rate | File | Good to know |
|---|---|---|---|---|
| Reports & print | Scalable | Still | SVG, PDF | Pro: vector shapes for supported 2D charts |
| Presentations | Custom size | Still | PNG; SVG, PDF on Pro | Match your fonts and colors to your slide deck |
| YouTube | 3840 × 2160 | up to 60 fps | MP4, ProRes | Transparent version for overlays on top of your footage |
| Shorts, Reels, TikTok | 1080 × 1920 | 30 or 60 fps | MP4 | Titles and captions are kept clear of the app's own buttons and text |
| Captions | Any video | Timed | Burned in; SRT, VTT | Written from your data, then edited by you; upload the file as closed captions |
| Instagram and LinkedIn feed | 1080 × 1080 | 30 fps | MP4 | Loops cleanly so it keeps playing in the feed |
| Newsletter | 1200 wide | 24 fps | GIF, PNG | Compressed to stay small enough for email |
| Blog or website | Any size | Live | Link, embed code | Live Plays in the page with play and scrub controls; the title, source and data are text search engines can read |
Free needs no card and never runs out. Pro and Team are billed from the first day, and you can cancel any time.
No card needed
Make charts, maps and video for as long as you like.
Billed $240 yearly
For data storytellers, designers and video creators.
Billed $468 yearly
For agencies, newsrooms and communications teams.
More than 3 people? Contact sales
Start with a spreadsheet and make the chart once: for the video, the deck and the page. Free for as long as you like, no card needed.
Make your first chart